Welcome to Doris Stoppacher's personal webpage
Personal research and project web page
Parameterizing the mass growth history
Summary: We use a one parameter model from Wechsler et al. 2002 to parameterize the mass assembly history of the main progenitor branch of a merger tree or the most massive progenitor of a halo, respectively.
Theoretical background
We use the approach of Wechsler et al. 2002 and their Eq.4 and Eq.5, respectively:
\[a_c= a_0 \alpha/S \text{ (1)}\] \[M(a) = M_0 \times \exp \Big[ -a_c S \big(a_0/a - 1\big) \Big] \text{ (2)}\]to parametrize the halo mass growth history. \(\alpha\) is the singe free parameter in the model and can be related to a characteristic epoch of formation \(a_c\). \(a_c\) is defined as the expansion factor \(a\) when the logarithmic slope of the accretion rate \(d\log M/d\log a\) falls below some specified value \(S\). \(S\) is connected via \(a_c\) to the singe free parameter \(\alpha\) as \(a_c=\alpha/S\). In the same way the formation epoch is defined for any “observing” epoch \(z_0\) by replacing \(a\) by \(a/a_0\) to find Eq.(1).
At any observing redshift \(z_0\) with the scale factor \(a_0=1/(1+z_0)\) and the mass of the halo \(M_0=M(z_0)\) the mass growth is fit by Eq.(2). For more details please see Sec.(4) in Wechsler et al. 2002.
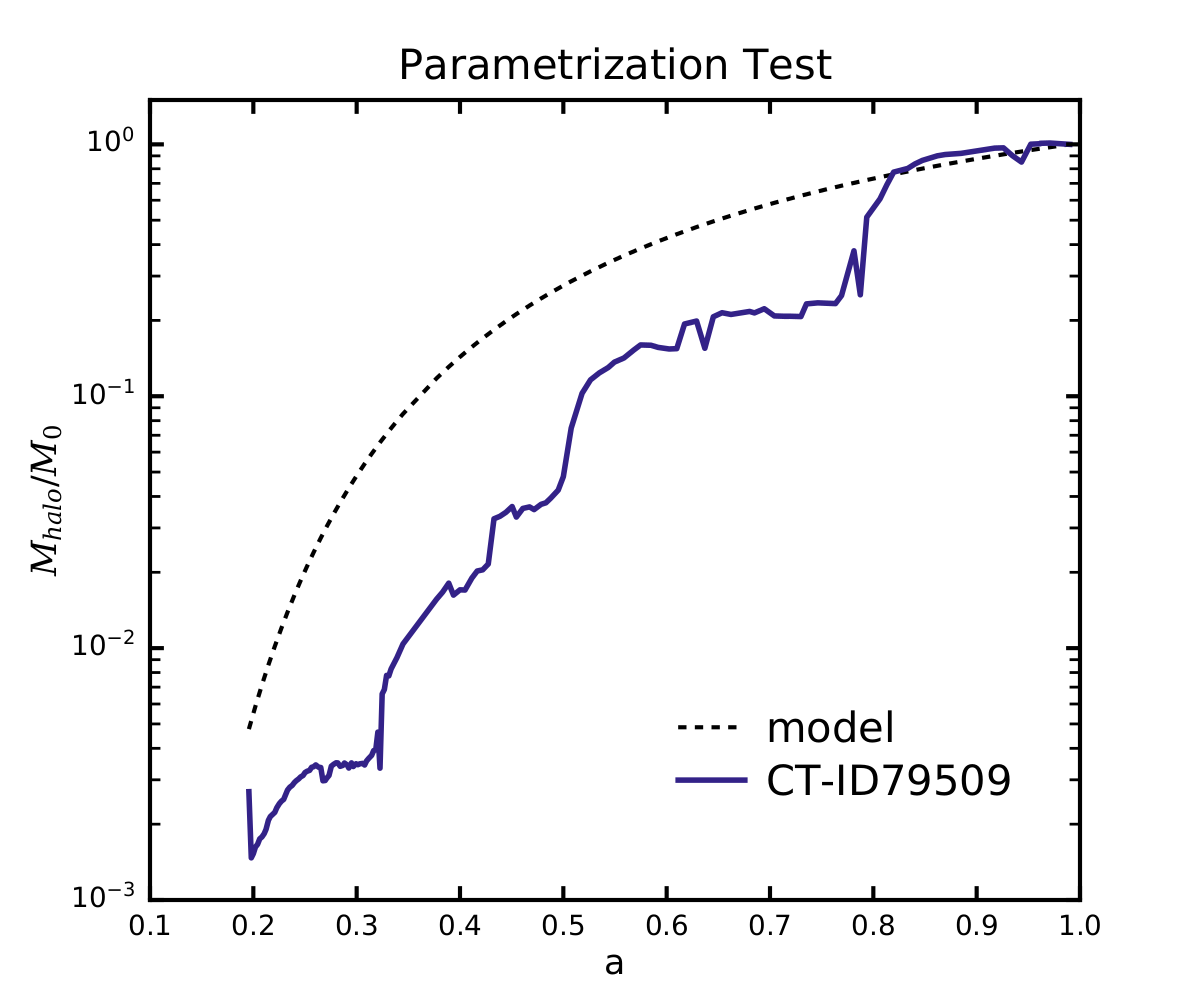
In Fig.1 we compare the parameterized mass accretion history using \(M_0\) as the halo mass our main progenitor halo CT-ID79509 found by Rockstar (RS) and tracked by Consistent-Trees (CT) holds at the snapshot of last detection. More details about this particular tree can be found in Fig.1 and Fig.2 our previous post from 2021-03-03. We further us \(S=2\), and \(\alpha=1.33\) in the Eq.(1) and Eq.(2).
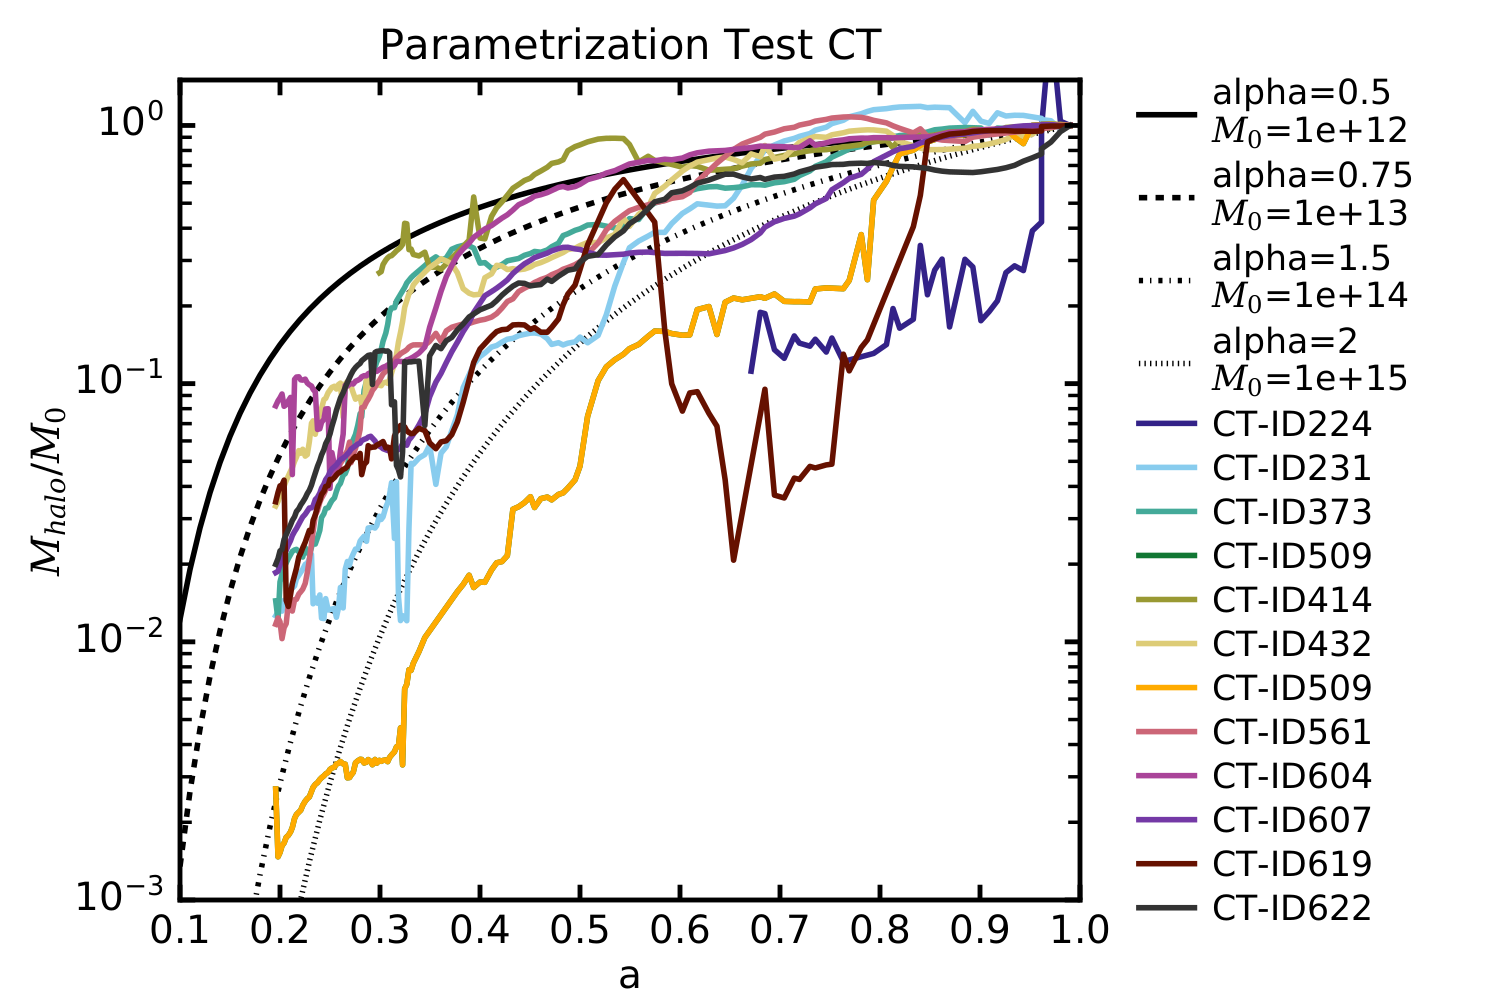
Parameterization test using custom-built trees & “Consistent-Trees”
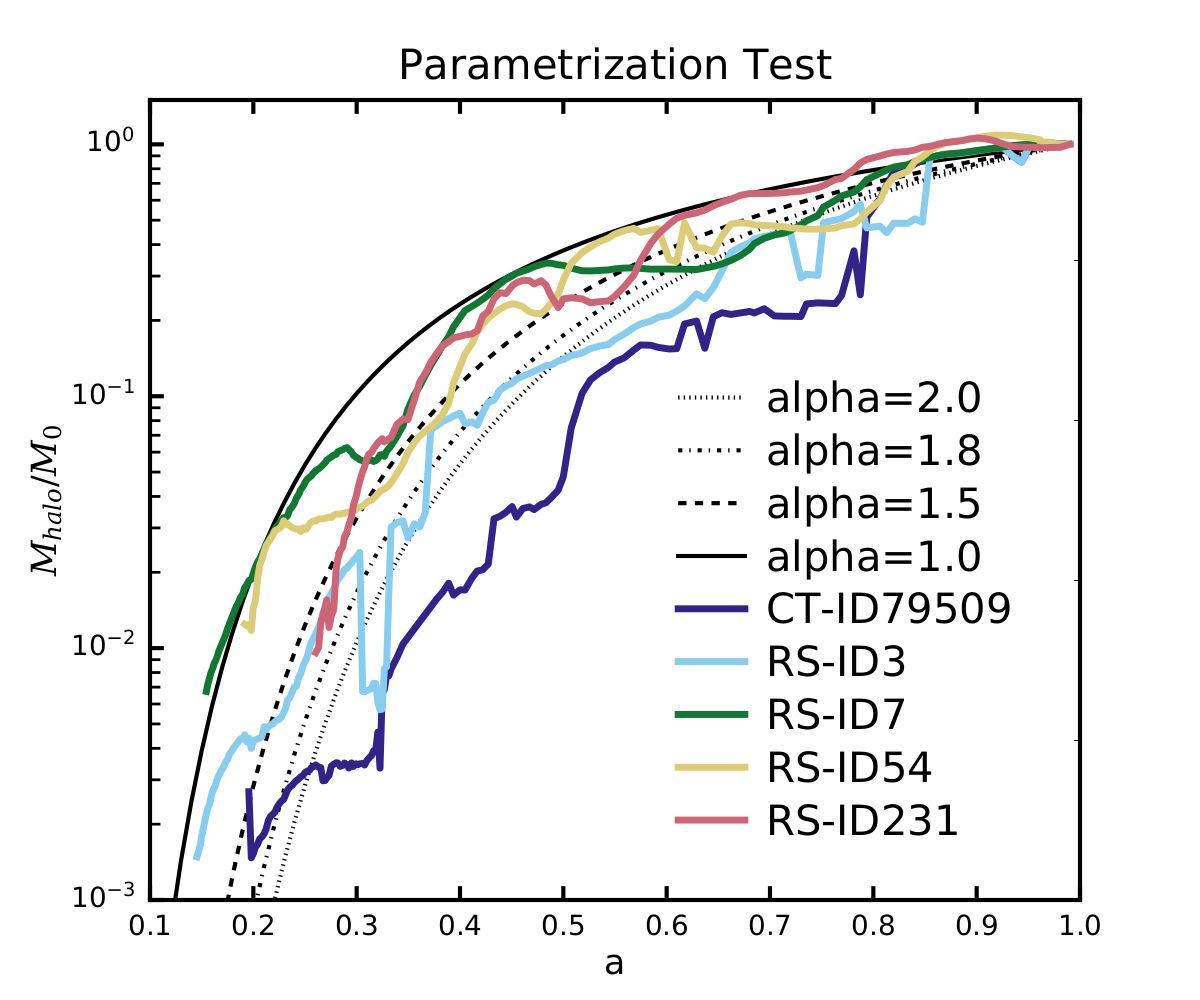
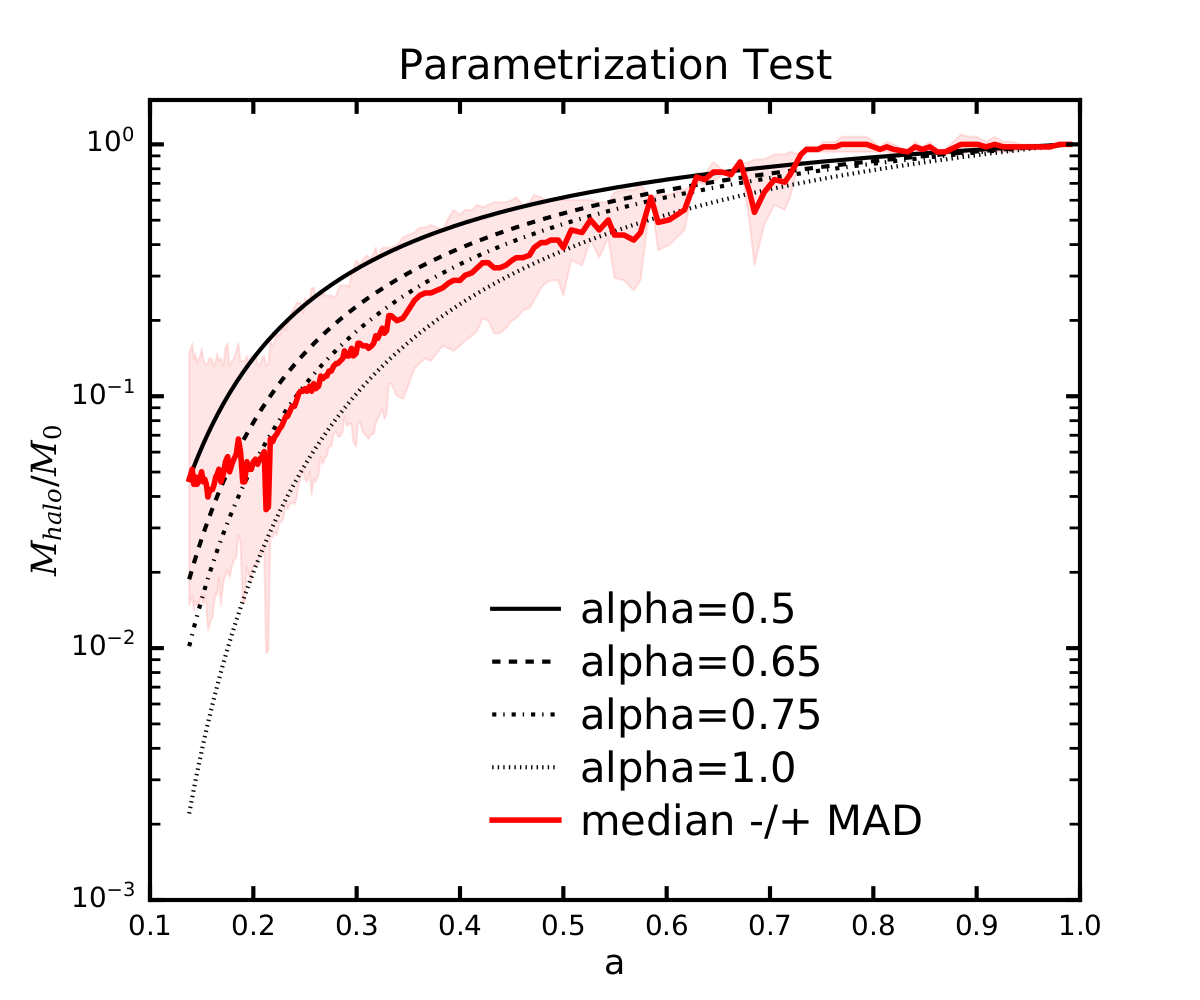
In the Fig.2 we show various visually inspected mass assembly histories of the main progenitor trees found by Rockstar (RS) (solid colored lines) in comparison to the assembly history of CT-ID79509 and various the parameterized functions using \(M_0=1 \times 10^{14}\) \([h^{-1}M_{\odot}]\), \(S=2\), and values for \(\alpha\) as indicated in Fig.2. In Fig.3 we show the median mass accretion history within uncertainties for all identified halos and their most massive progenitors. We furhter use information from our previous posts on the series: A testrun on merger trees.
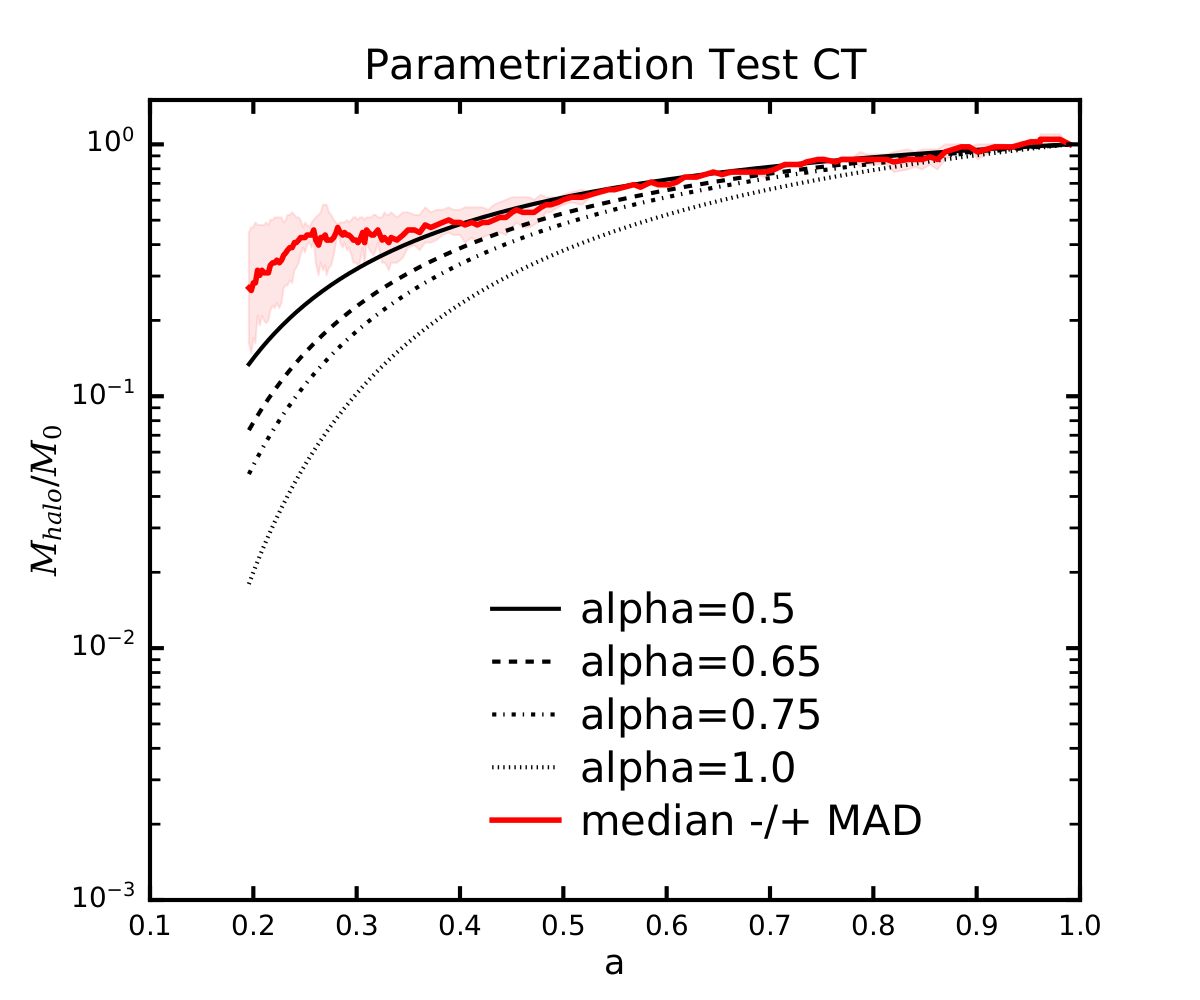
Parameterization test using only trees from “Consistent-Trees”
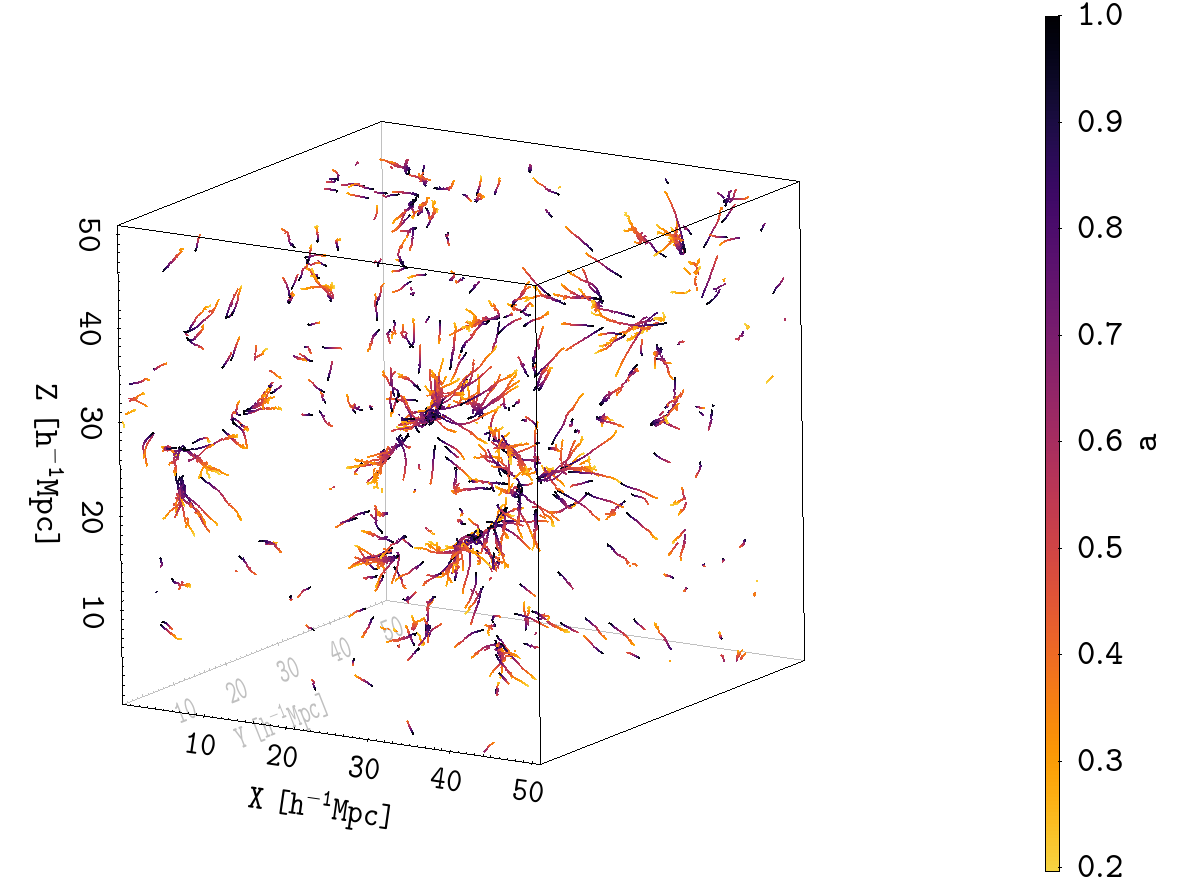
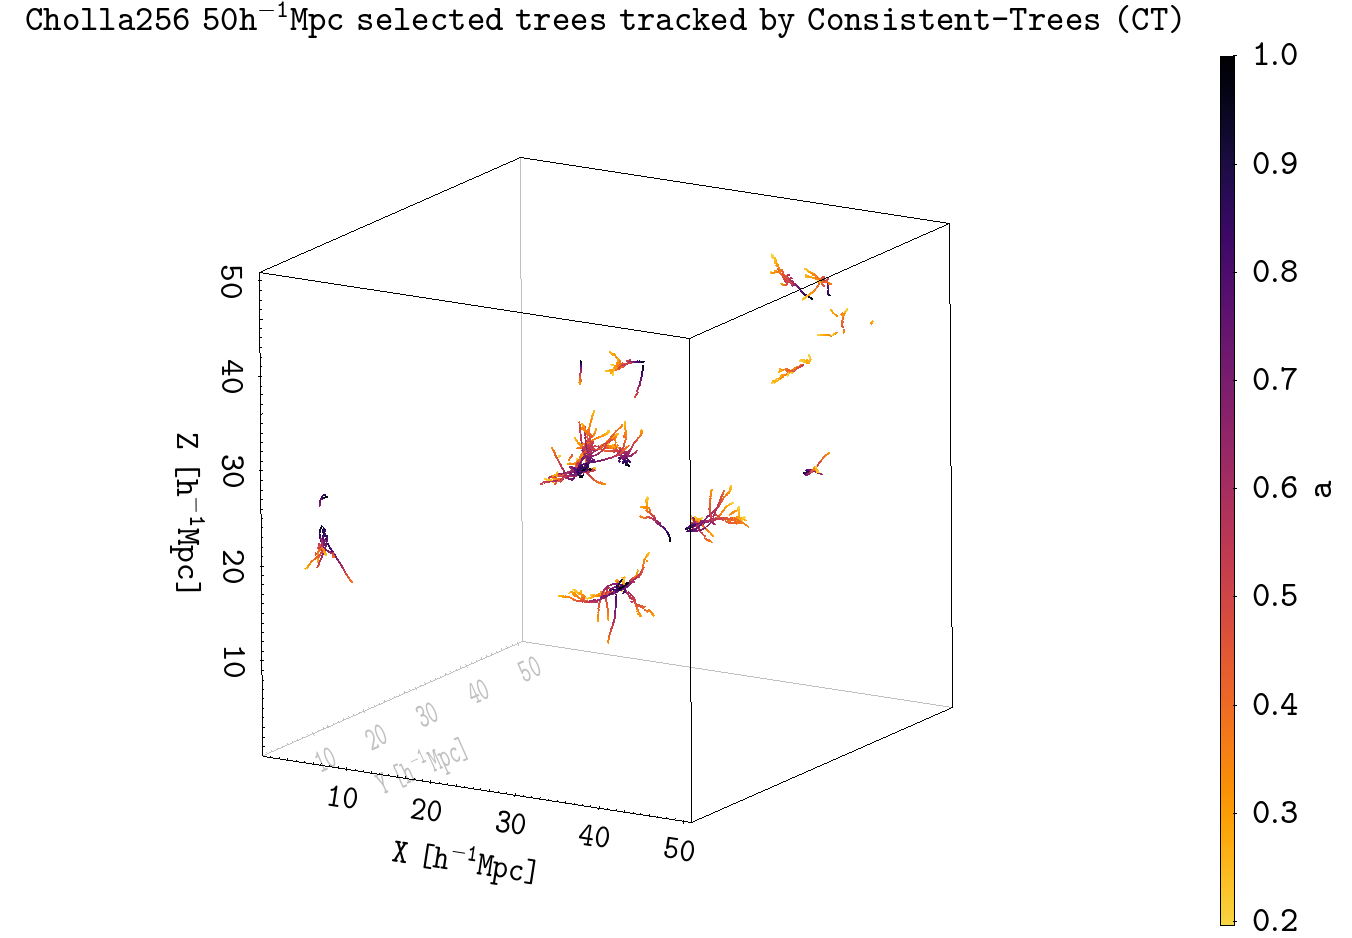
Here we show plots using the merger tree information from Consistent-Trees (CT). We further use information from our previous posts on the series: A test run on merger trees. In Fig.4 we show the positions of all halos found by Rockstar (RS) and tracked by Consistent-Trees (CT) in the 3D-box of Cholla-256 with a side-length of 50\(h^{-1}\)Mpc.
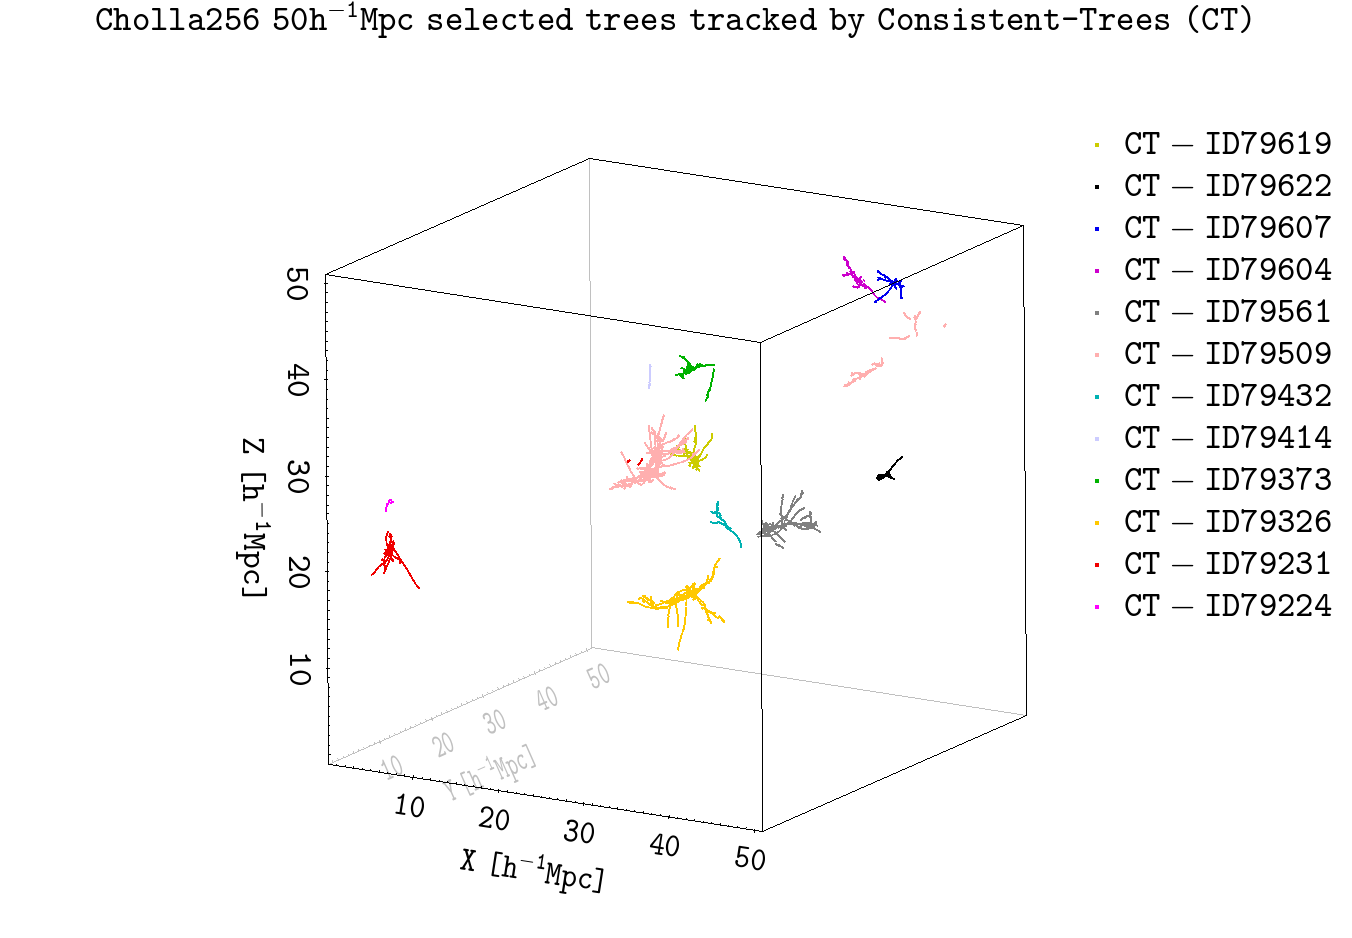
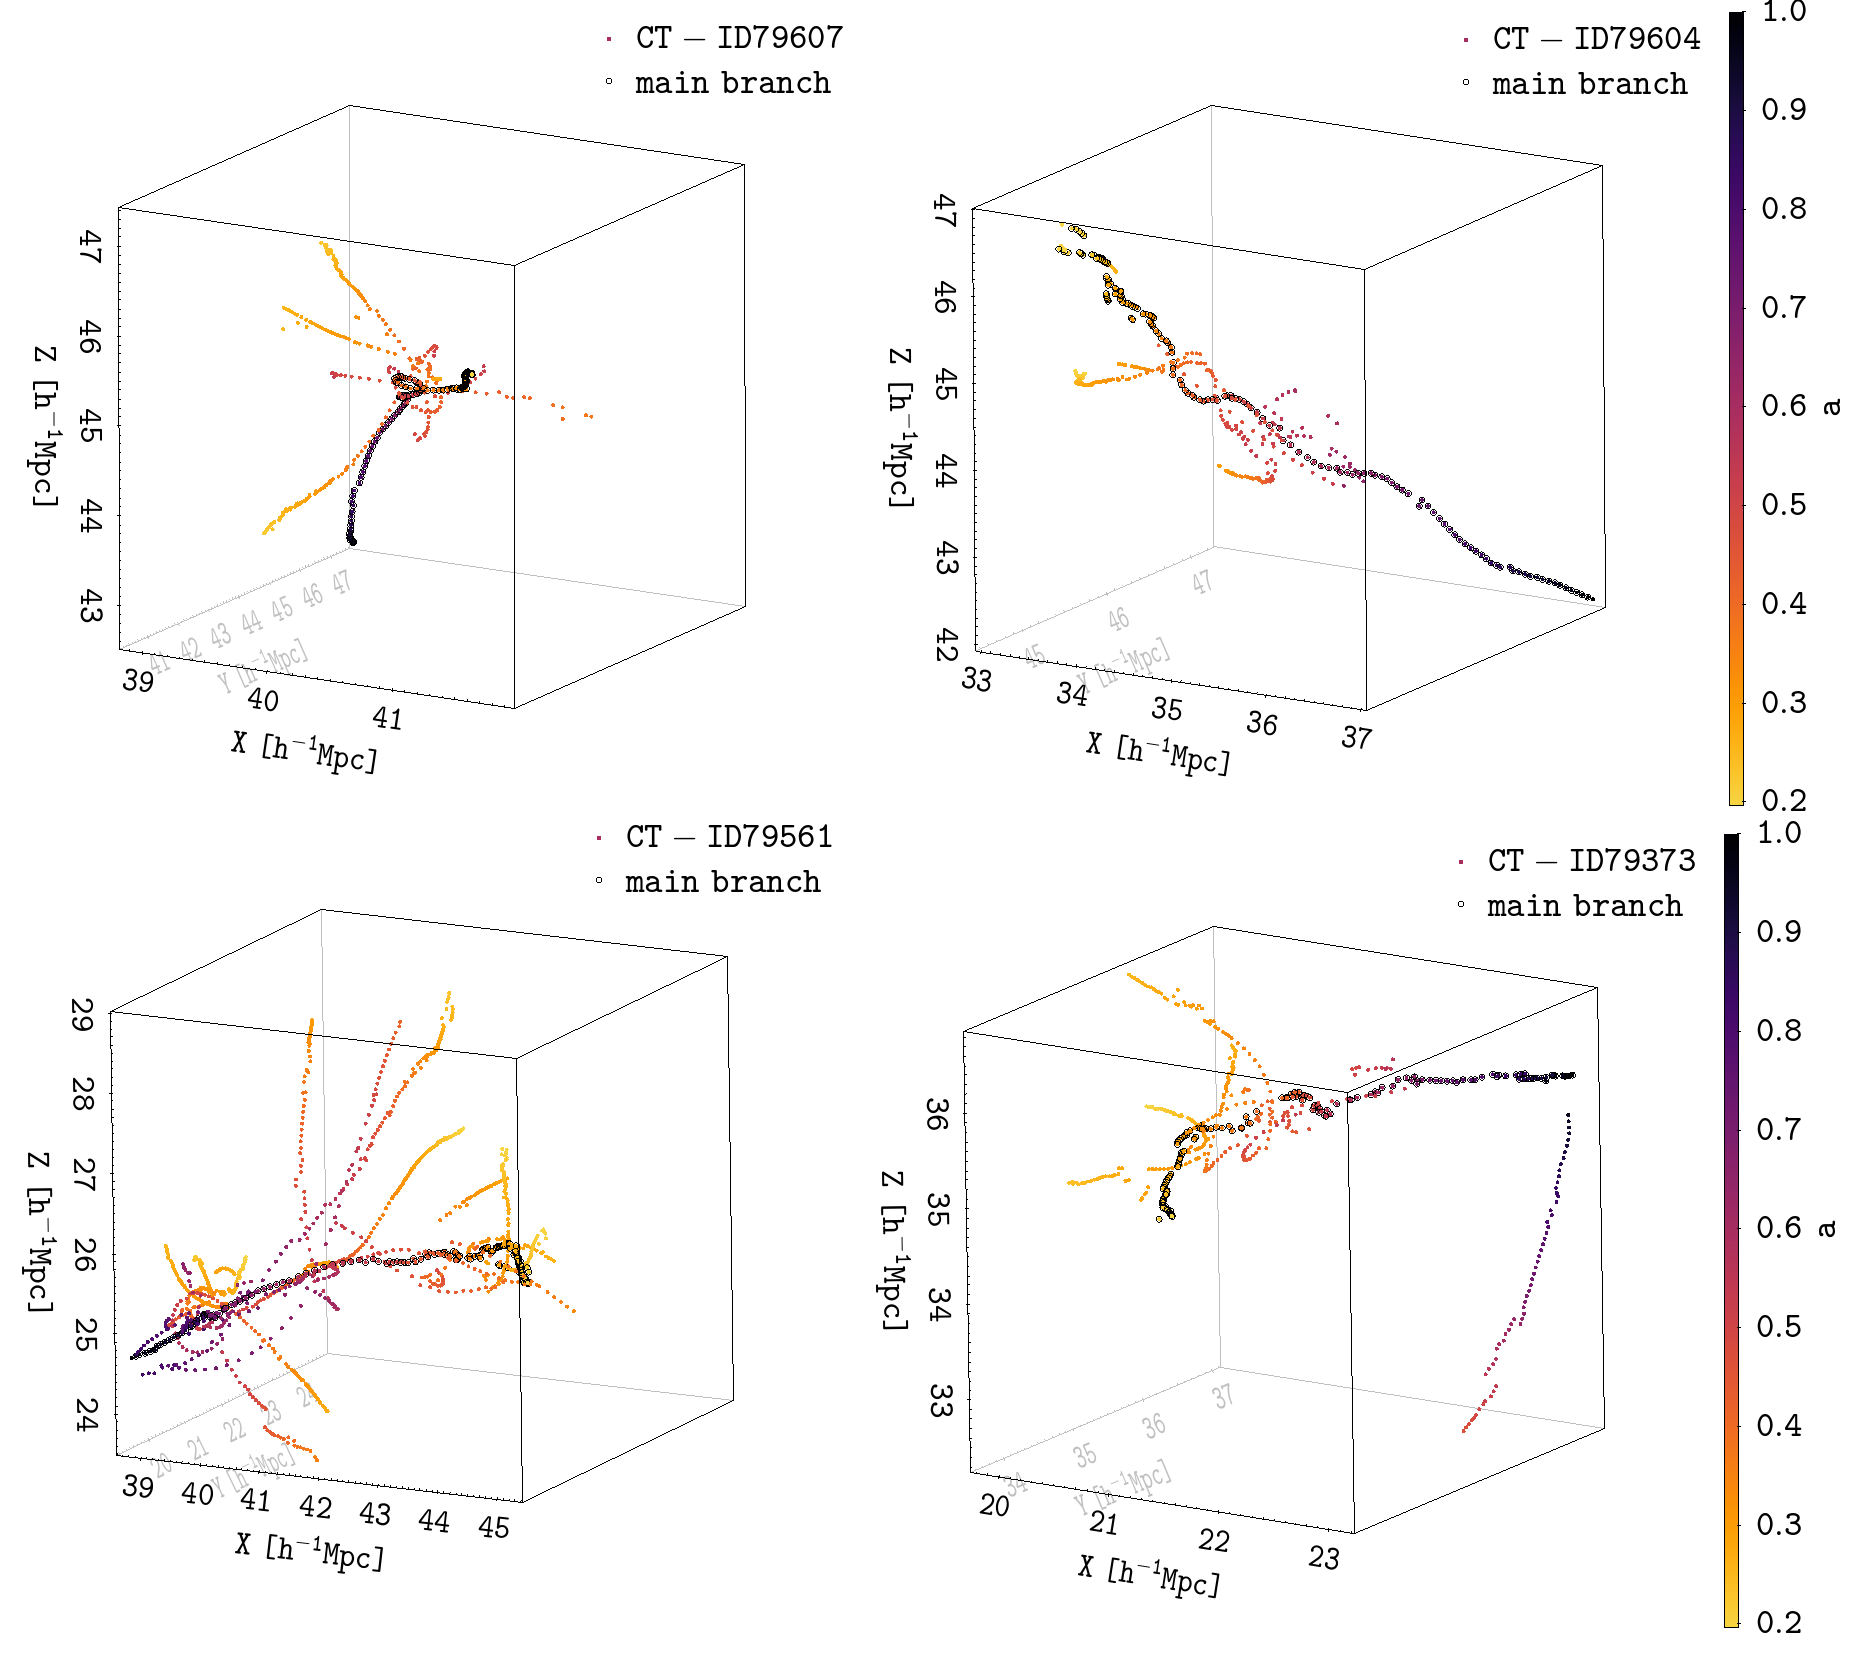
In Fig.5 and Fig.6 we show in the redshift evolution of the position of selected merger trees from the same box, among them the most massive (CT-ID79509), largest (CT-ID79622), and least massive trees (CT-ID79224) as indicated by the colors. In Fig.7 we shown the trajectories of four selected merger trees from Fig.6. The scale factor of each snapshot is represented by the color bar. Their main branch is marked by a black open cycle.
In Fig.8 we use the main branches of our selected halos shown in Fig.6 and calculated the mass accretion history of each individual tree and main branch. Median mass accretion history incorporating all halos on the main branch as shown in Fig.5 within its uncertainty can be found in Fig.9 (for details of its calculation see the post from 2021-02-26).
A Python script which creates the figures in this post can be found here